Inkling Efficacy Analysis - Summer 2026 GCSE Results
Study based on 113 students · 250 hours of Inkling’s AI tutoring · measured against prior student attainment.
Clifton College introduced Inkling in November 2025 for its Year 11 English Literature cohort. In August 2026 that cohort sat the Edexcel IGCSE exams. This page reports what happened, measured against the Year 10 mock the same students sat in Summer 2025, before any Inkling usage.
Students who used Inkling regularly finished 1.25 of a GCSE grade above those who didn't.
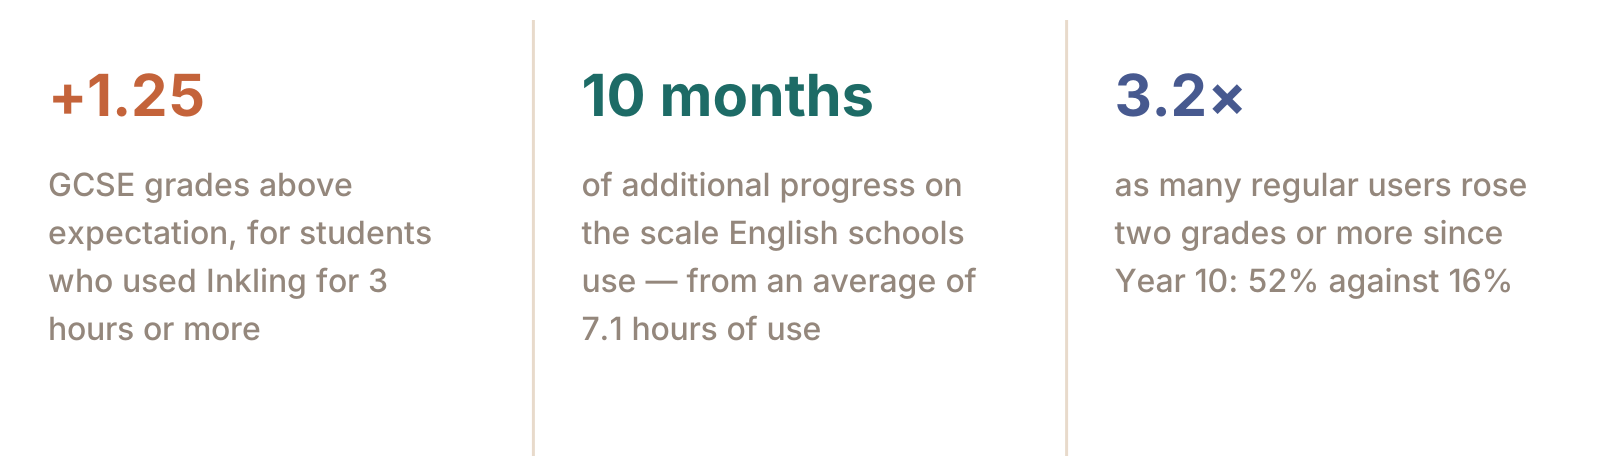
A student on 60% at Year 10: non-users at this school averaged 71% at GCSE, regular Inkling users averaged 79%.
Where the two groups finished
Here is how the students in the two groups scored on final GCSE exams:
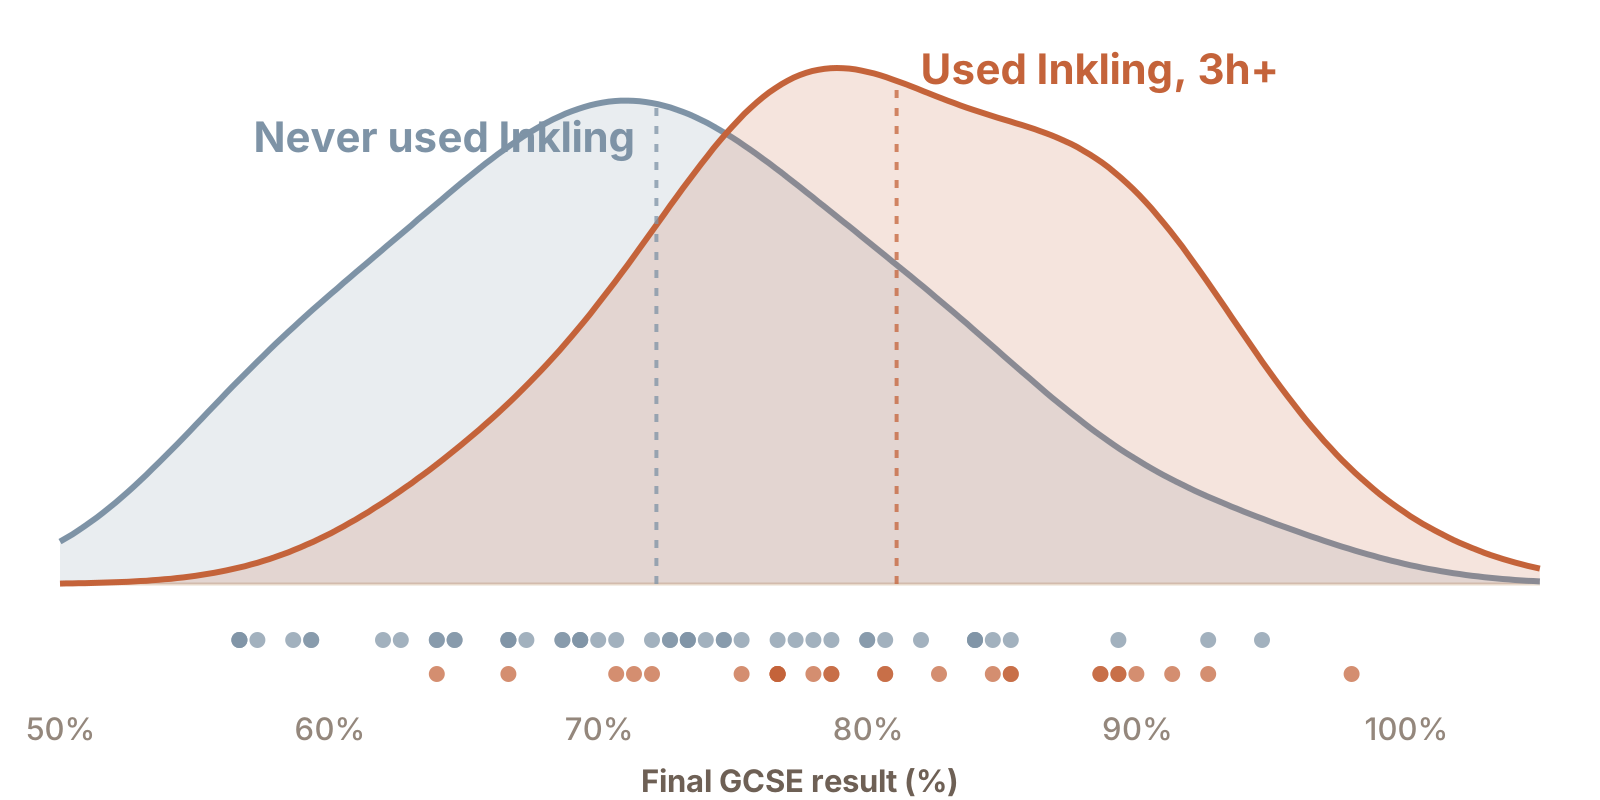
Inkling average of 81.1% against 72.2%.
Adjustment for prior attainment
To ensure we are comparing like with like rather than simply comparing stronger and weaker students, scores were then adjusted for this analysis based on each student’s Year 10 mock result. We used non-users to estimate the expected score change for students over Year 11, and then measured how far each student performed above or below that benchmark.
Inkling users achieved higher grades and improved more
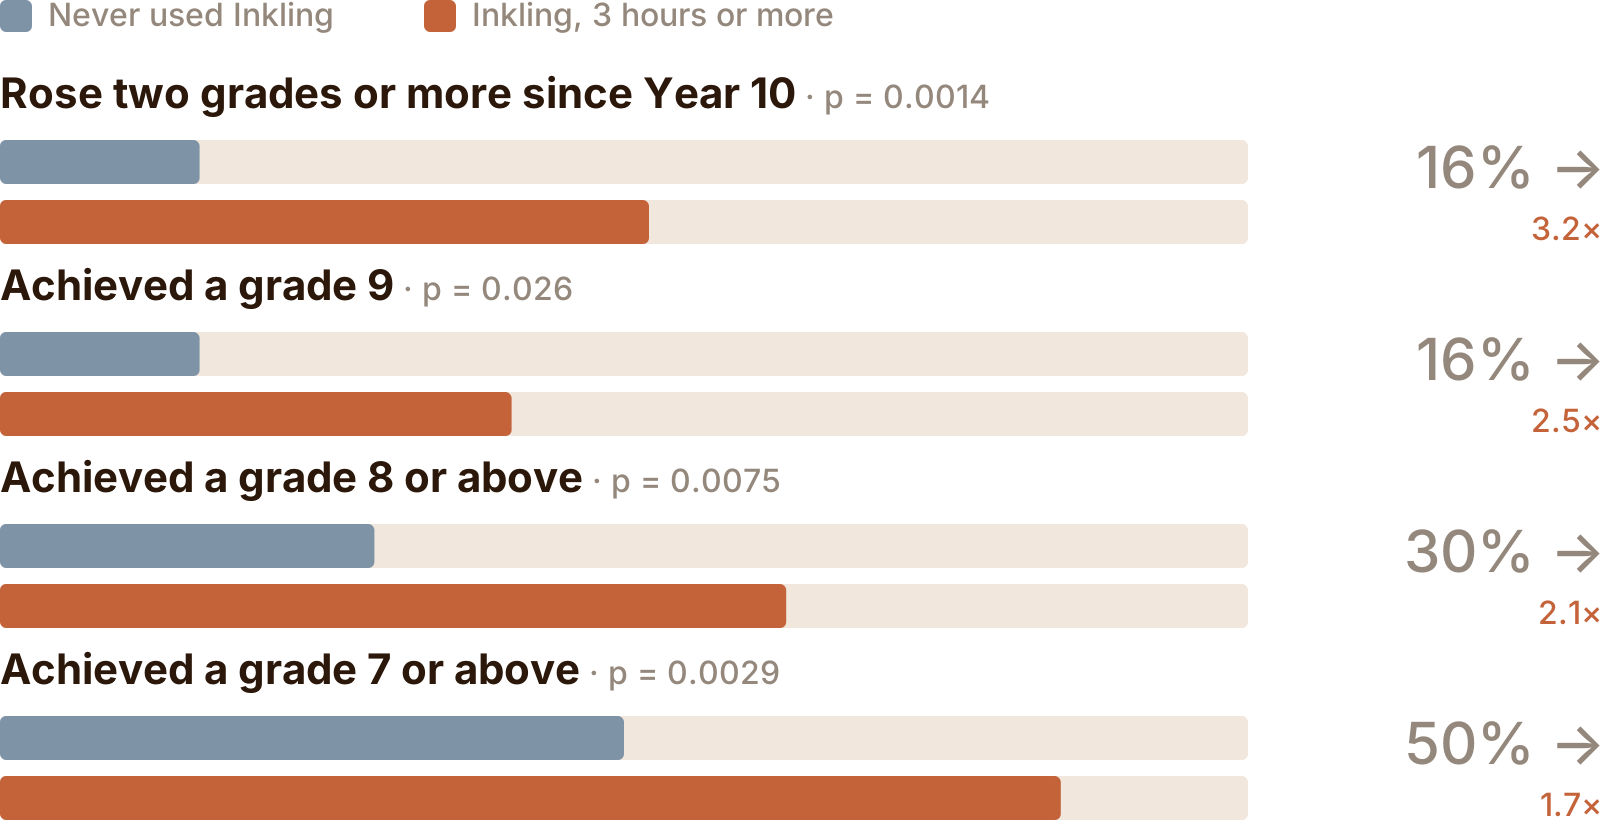
Half the regular users climbed two full grades or more from their Year 10 mock, against one in six of the non-users. They took 11 of the cohort’s 26 grade 9s. And every one of them finished on at least a grade 6, where 18% of non-users finished at a grade 5 or below.
The more students used Inkling, the more they gained
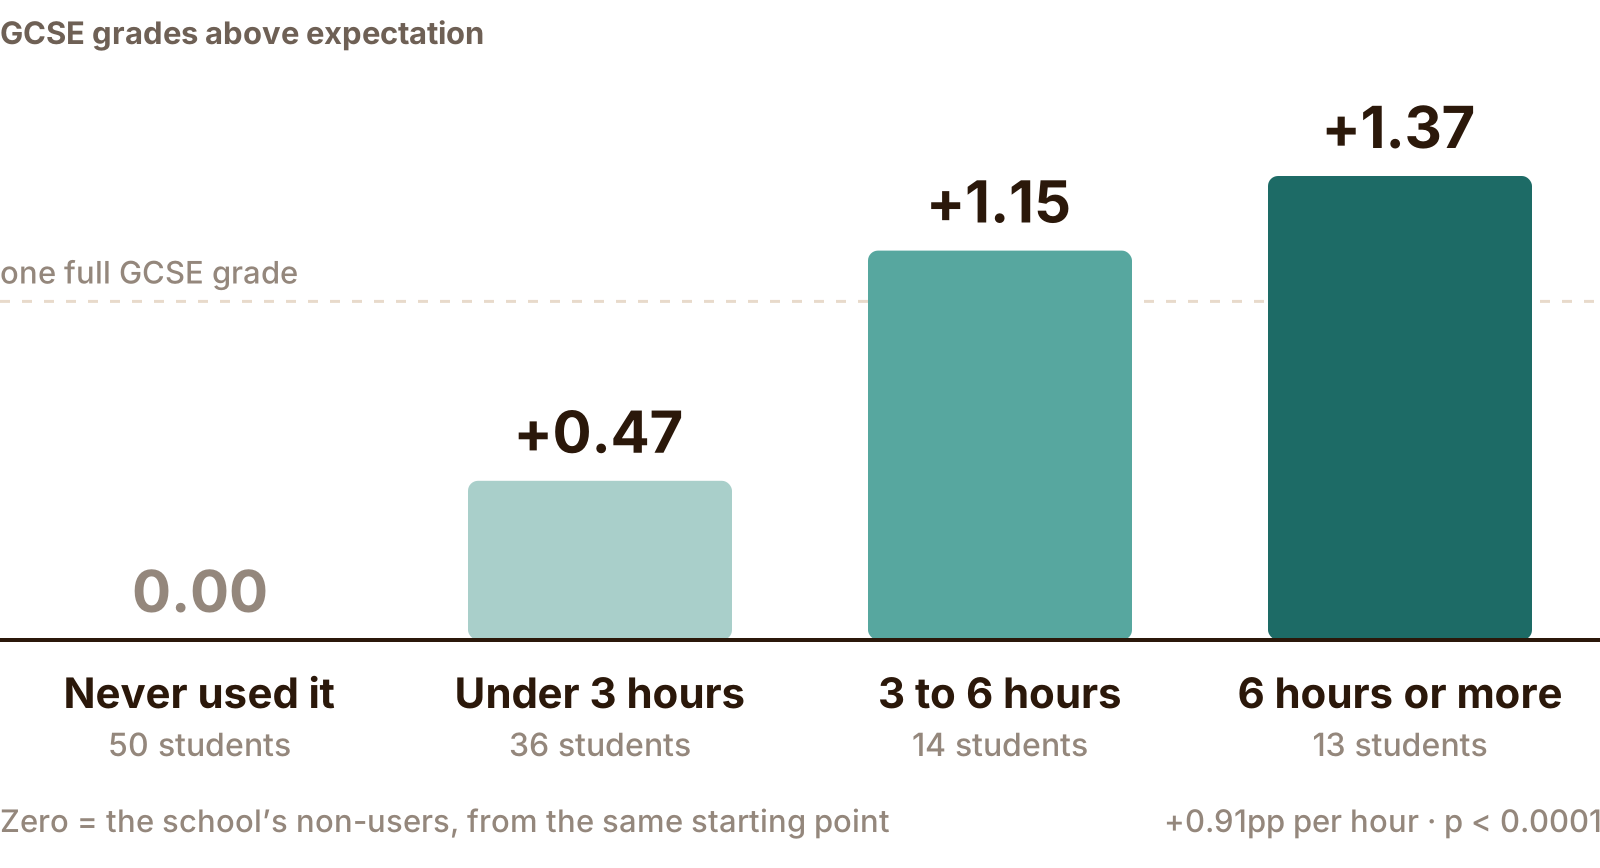
The four groups began the year within 4.9 percentage points of each other and finished 9.6 points apart. Each additional hour of use was worth +0.91 percentage points, about seven hours per GCSE grade. Comparing students only against their own teaching set it is +0.64 points, or ten hours a grade.
Inkling helped the students who needed it most
The cohort split into thirds by Year 10 results, with each third’s two group averages plotted on the exam scale:
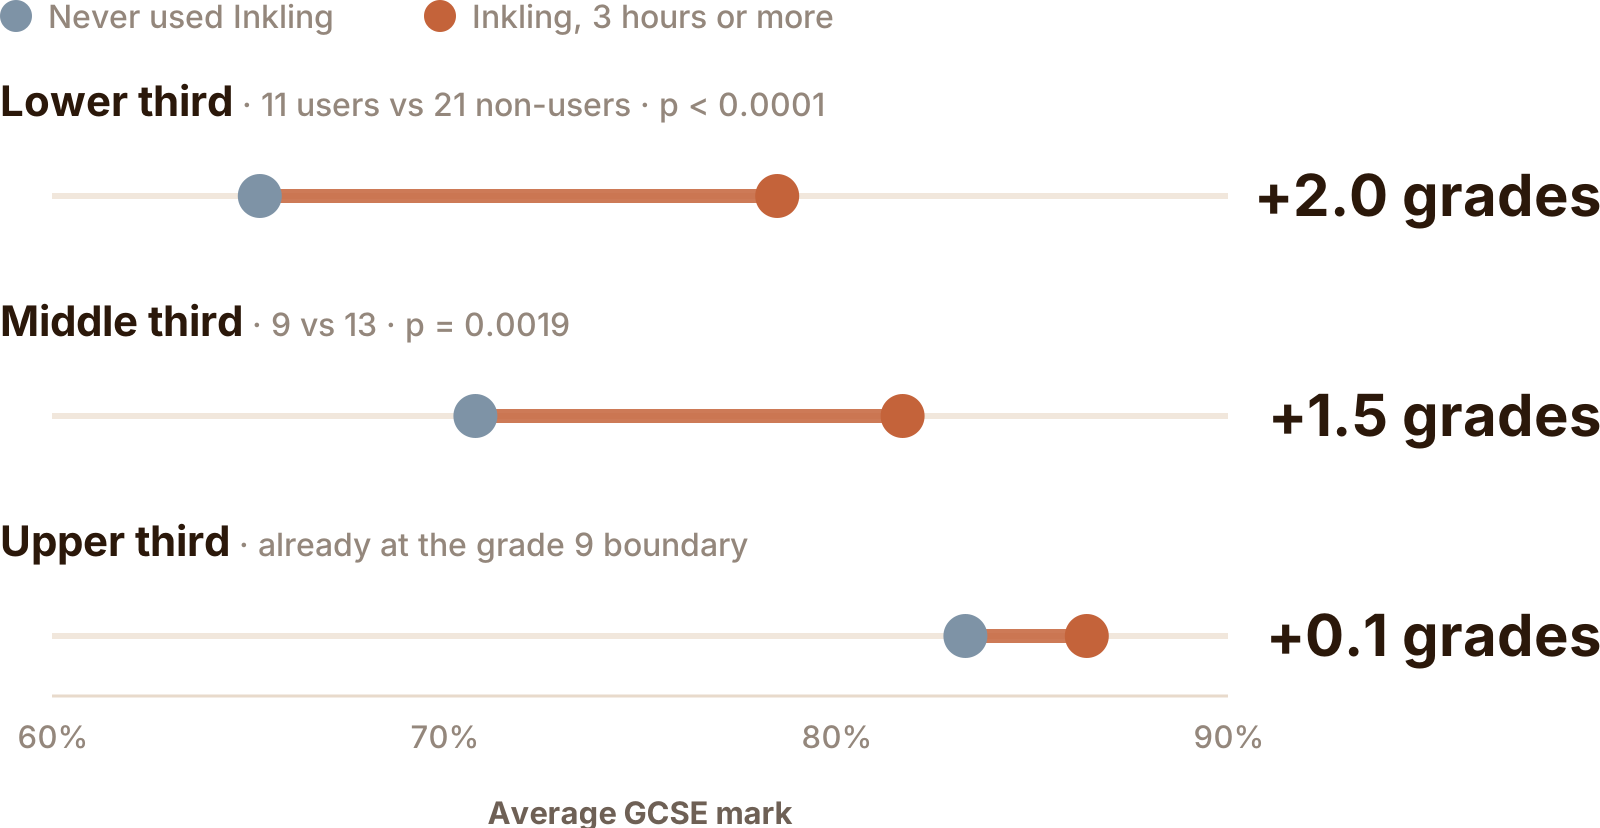
The lower third gained two full grades and the middle third a grade and a half, and both hold up when students are compared only against their own teaching set. The upper third increased less, as is expected with less room for improvement.
That is the reverse of the usual pattern. Most educational software typically delivers for the high achievers, as it requires a large degree of student self-motivation.
Effect size: 3x Typical Edtechs
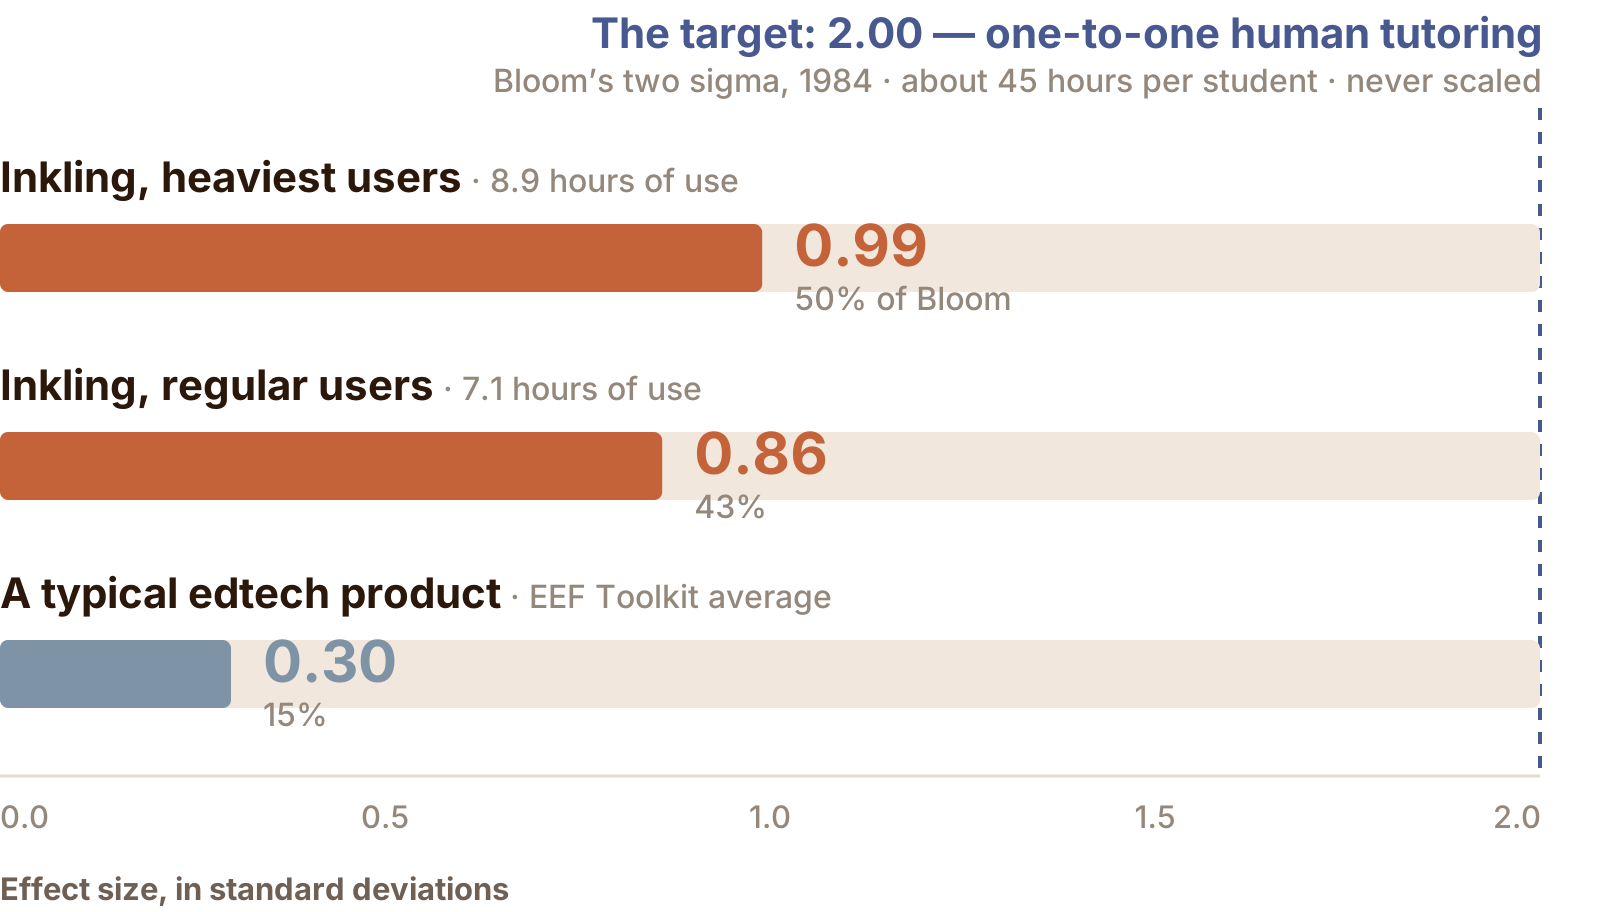
Bloom (1984) found that one-to-one human tutoring lifted attainment by about two standard deviations - the result education has chased ever since and never scaled, because it needs one tutor per child. Inkling’s regular users reached 0.86 of a standard deviation and its heaviest users 0.99, against 0.30 for the average intervention in the EEF Teaching and Learning Toolkit.

Selection on prior attainment
Regular users averaged 65.4% at the Year 10 mock against 62.3% for non-users; the difference is not significant (p = 0.33). Every figure above adjusts for prior attainment in any case.
General motivation rather than the tool
29 students in the cohort also used Inkling for other subjects. Those hours do not predict their English result (−0.15pp per hour, p = 0.65), while their English hours do (+0.95pp per hour, p < 0.0001). A general disposition to work would have moved both.
Clustering by teaching set
Adoption did cluster by teaching set. The analysis was re-run comparing students only against their own set: the effect persists at +5.0pp (p = 0.0023, standard errors clustered by set).
A cohort or school effect
Any school-wide change applied to all 113 students - same year, same papers, same teachers - and cannot account for the gain scaling with hours of use.
What cannot be excluded
Dose was self-selected. Motivation directed at this subject in particular would produce the pattern observed here. The claim made is therefore that students who used Inkling achieved more, not that Inkling alone caused it.
Sensitivity to model specification
Students who started at the same point did not finish at the same point.
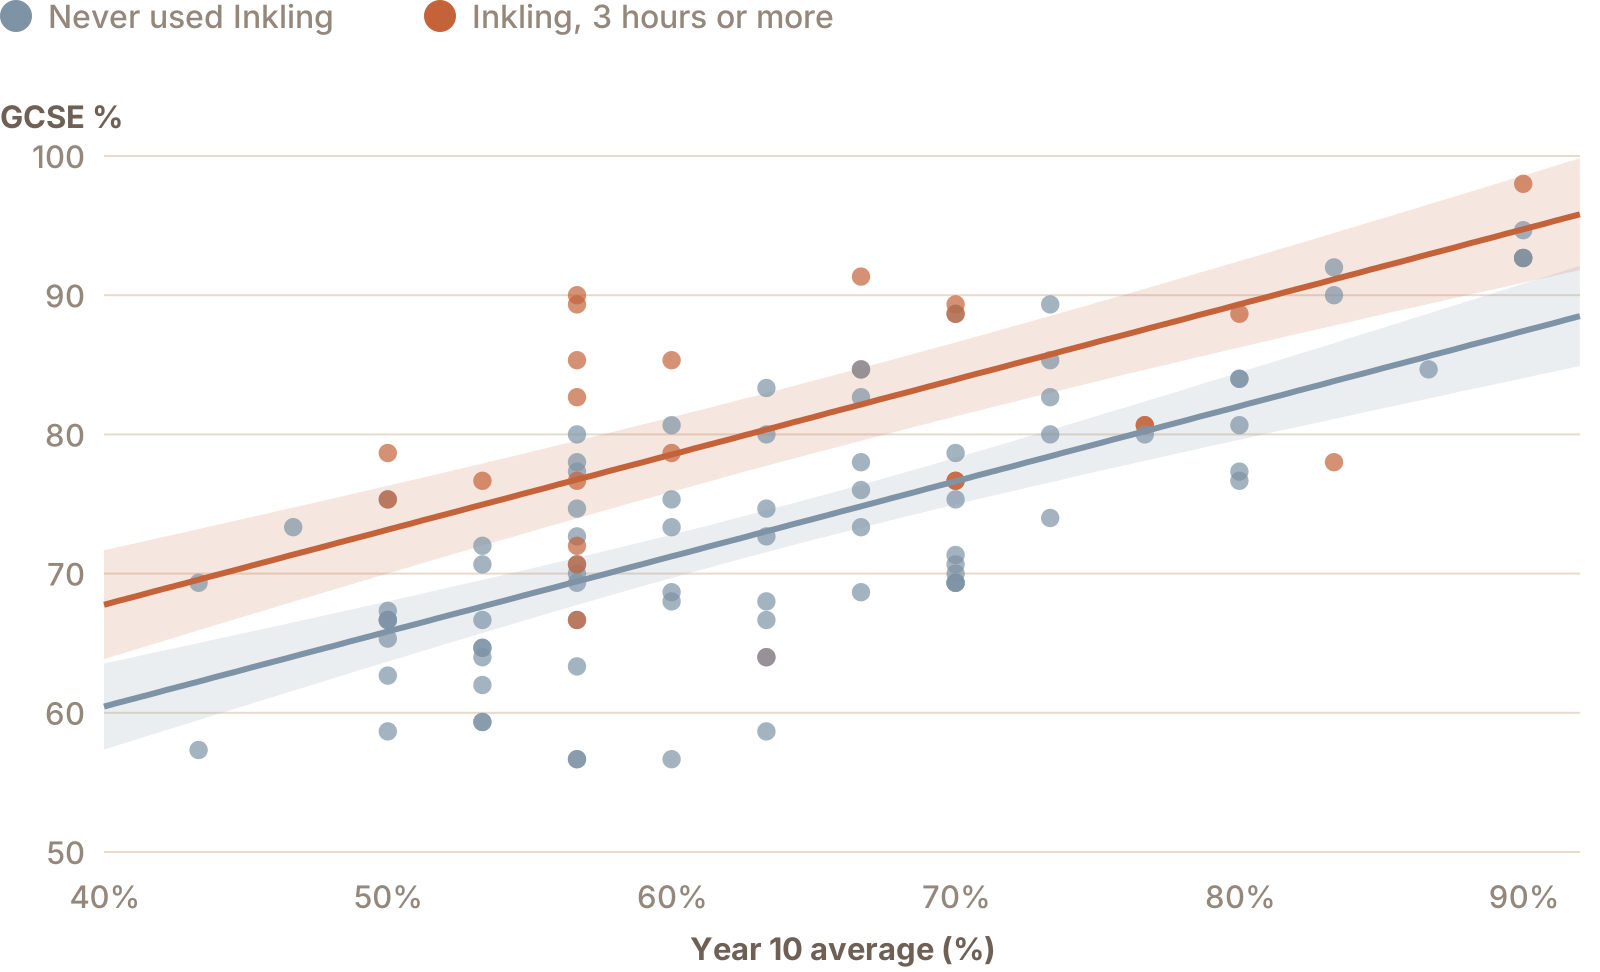
Ordinary least squares, GCSE % on Year 10 % plus an indicator for three or more hours of use. n = 104; two students had no Year 10 record and are not plotted. Bands are 95% confidence intervals for the fitted mean, so they are narrow where there are many students and wide where there are few.
Re-estimating the same gain under progressively more conservative specifications tests whether it depends on the model chosen. It does not.
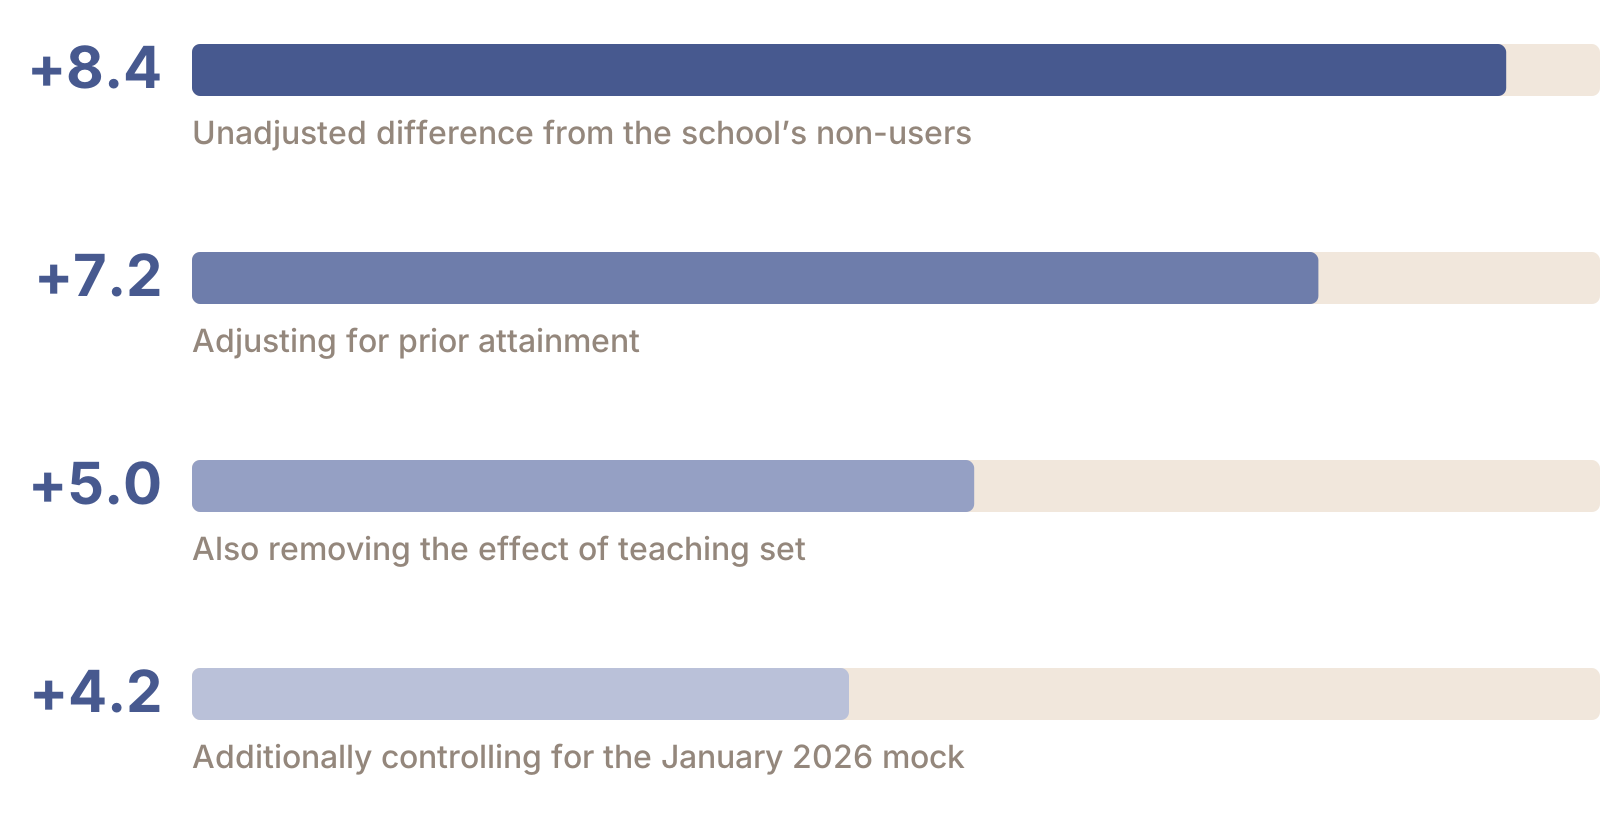
The estimate falls from +8.4pp to +4.2pp as prior attainment, then teaching set, then the January 2026 mock are added as controls, and remains significant in all four. The last of these adjusts for a mock sat after 97 of the 250 tutoring hours had already been delivered, so it subtracts part of the effect it is measuring; it is a floor rather than an estimate.
Subgroup estimates
By starting third: lower +2.0 grades (p < 0.0001, 11 users against 21 non-users, +8.2pp within teaching sets); middle +1.5 grades (p = 0.0019, 9 against 13, +15.1pp within sets); upper +0.1 grades (p = 0.70, not significant), that group having entered the year at the grade 9 boundary. Grade outcomes by Fisher exact test: rose two grades or more p = 0.0014; grade 9 p = 0.026; grade 8 or above p = 0.0075; grade 7 or above p = 0.0029; grade 6 or above p = 0.023.
Effect sizes in full
Cohen’s d for users against non-users, on value added and on the raw exam mark, with Welch’s t-test. Two p-values per row: value added, then raw GCSE %.
Group | Students | Value added (d) | GCSE % (d) | Welch p |
|---|---|---|---|---|
Any use vs non-users | 63 | 0.73 | 0.56 | 0.0003 / 0.004 |
3h+ vs non-users | 27 | 1.16 | 0.97 | 0.00002 / 0.00008 |
5h+ vs non-users | 17 | 1.37 | 1.16 | 0.00004 / 0.00005 |
The d on value added is measured against the spread of value added itself; the 0.86 and 0.99 quoted above divide the same gain by the spread of the exam, the more conservative convention and the one comparable to Bloom and the EEF. Every way of measuring it lands between 0.56 and 1.37. Value-added figures use the students who have a Year 10 baseline (59, 26 and 16 respectively).
Method
Design | Quasi-experimental cohort study with a pre-intervention baseline. 123 Year 11 students; the 113 with a final result form the analysis sample. Edexcel International GCSE English Literature 4ET1, Summer 2026. |
|---|---|
Baseline | Every student’s Year 10 mock, Summer 2025 - sat before Inkling was introduced in November 2025. |
Benchmark | A prediction line drawn only from students who never used Inkling (the 47 of them with a Year 10 baseline). They average exactly zero, so they are the yardstick. |
Groups | Non-user: under 15 minutes across the year (50 students). Regular user: 3 hours or more (27 students, averaging 7.1). |
Unit | One GCSE grade = 6.67 percentage points, the average grade width in this cohort’s results. |
Intervention | 250 hours of Inkling tutoring across 920 sessions between November 2025 and the examinations: 173 hours on To Kill a Mockingbird, 76 on the Poetry Anthology. |
Statistics | Welch t-tests for means, Fisher exact for proportions, OLS with HC1 robust standard errors and errors clustered by teaching set, Mann-Whitney U and 50,000-draw permutation tests as distribution-free confirmation, and a 10,000-resample bootstrap for the headline interval. Computed in Python. |
Limitations | Dose was self-selected; adoption clustered by teaching set; and this is one school, one subject, one cohort. |
Sources | Examination results supplied by the school, August 2026. All usage taken from the Inkling production database. The full data is available on request. |
Definitions
Above expectation - a student’s GCSE result minus what students at their own school, starting from the same Year 10 mark, actually achieved without Inkling.
Effect size - how far apart two groups are, measured in the natural spread of the results themselves. Education research uses it to compare a gain on one exam with a gain on a completely different one. Below 0.2 is negligible; 0.4 is a good year’s teaching; above 0.8 is large.
p-value - the probability of seeing a gap this large if Inkling made no difference at all. Below 0.05 is the conventional bar for taking a result seriously; below 0.001 is about one in a thousand. Most figures here are below 0.001.
Months of progress - the Education Endowment Foundation’s conversion, used by English schools to compare interventions on a common scale. An effect size of 0.86 converts to roughly 10 months.
Regular user - 3 hours or more of Inkling English Literature across the year: 27 students, averaging 7.1 hours. Every threshold from 15 minutes to 6 hours was also tested, and all of them show a significant gain.